From the Allison Ziefert Real Estate Group
As a local real estate agent there’s one question that I get asked on a daily basis: “How’s the market?” We are proud to present the first of our monthly series for the Village Green creatively titled “How’s The Market?” We hope that this deeper dive into SOMA’s real estate market stats proves useful and, if you have any questions, we are ALWAYS happy to talk with you.
First some basic definitions:
DOM or Days on Market is the number of days from the date a property is listed until it goes “under contract.”
LP:SP or List Price to Sale Price Ratio is the sale price of the property divided by the price it was listed at. Properties selling at 100% sold at full asking price.
SP:AV or Sale Price to Assessed Value Ratio is the sale price of a property divided by its assessed value (the value the town has given the property for taxation purposes).
Rate of Absorption is calculated to determine how many months it would take to sell all of the currently available homes on the market if no new properties were listed. It’s a good indication of whether it’s a buyers’, sellers’, or balanced market. It is calculated by taking the number of sold properties in a certain time frame (we will use the last 3 months) and dividing that by the number of days in that timeframe to figure out how many properties sell in an average month. Then the total number of active homes is divided by that number allowing us to see how many months it will take to absorb the current inventory. In a balanced market it would take 5-7 months to absorb the homes on the market. Fewer months would be a sellers’ market and any more would be a buyers’ market. Here is an example: In Mayberry, 30 homes sold over the last 3 months. That’s an average of 10 homes per month. If there are 20 homes on the market and no new properties have come on the market then it would take 2 months (20 divided by 10) to sell all of those homes — a very tight supply and a sellers’ market.
Now here are the most recent stats for the two towns.
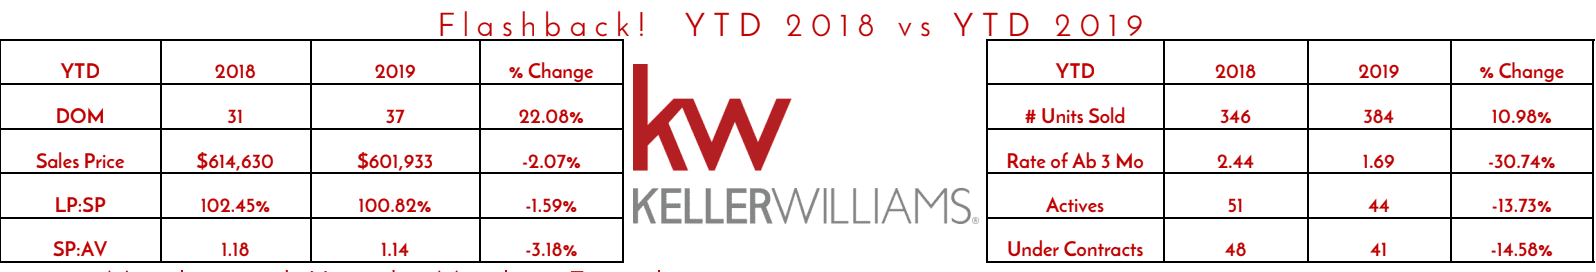
Maplewood Stats:
South Orange Stats:
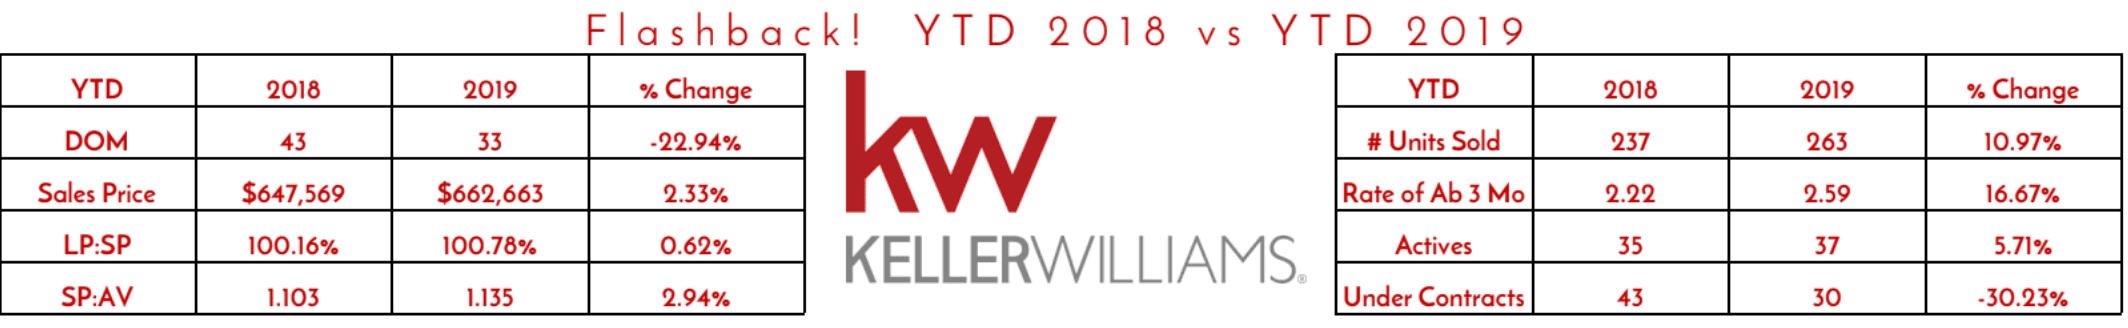
The tables above compare the performance of each town between 2018 and 2019. In Maplewood, key metrics showed a softening in the market from 2018. Average days on market increased by over 20% from 2018 by while average sales price decreased by over 2% in the same period. Conversely, South Orange saw a more than 20% decrease in average days on market and a more than 2% increase in average sales price year over year. Overall though, both towns continue to be strong sellers’ markets with a tight 2 months, plus or minus, of inventory in supply.
More detailed reports on the SOMA market and many other communities are available on our website Allison Ziefert Real Estate Group’s Local Market Reports. If you would like to, you can receive them in your inbox. Just reach out to us with your complete contact information and we can send them to you monthly.
The Allison Ziefert Real Estate Group is a top producing real estate team based at Keller Williams MidTown Direct in Maplewood, NJ. We are local market experts, specializing in real estate and homes in Maplewood, South Orange, Millburn/Short Hills, Montclair, West Orange, NJ and the surrounding towns. We are driven by earning great testimonials and referral business from happy clients. You can read our testimonials at www.azhomesnj.com/testimonials.