After years of racial demographic stability, South Orange and Maplewood are now seeing a rise in the White population and a decline in the Black population. There is also a growing income gap between the White and Black populations.
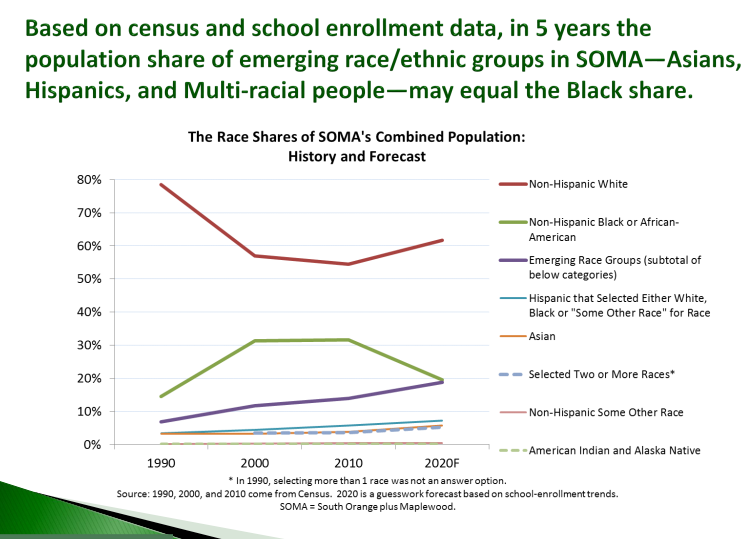
The towns combined maintained a Black population in the low 30% range from 2000 to 2010 and a White population in the mid to high 50% range during that same time. However, the numbers started diverging around 2010, with the combined White population of the towns edging over 60% by 2016 and the Black population sinking to the mid-20% range.
If trends continue, the White population will be over the 60% mark by 2020, with the “Emerging Race Groups” population of Asian, Hispanic and “Multi-Racial” equaling the Black population at around 20%.
These trends were described and discussed — along with other demographic information and trends — at a presentation of the study “Demographic Trends in South Orange and Maplewood” at the Maplewood Library by the South Orange-Maplewood Community Coalition on November 10.
The introduction for the report, performed by the Coalition, explained its rational: “The two towns of South Orange and Maplewood have demonstrated a commitment to racial integration through their support of the Community Coalition on Race since 1996. Stable racial integration in housing and all aspects of community life has been an essential component of the Community Coalition on Race’s intentional integration mission for 20 years. This report presents a demographic profile of the two towns over time in order to establish where we have been, where we are now, and what trends we see in residential integration in SOMA.”
Coinciding with the advent of midtown direct train service, the Coalition began a marketing program to stave off “White flight” in the late 1990s and attract White residents who would appreciate the diverse community that South Orange and Maplewood provide. Real estate tours were organized, ads were placed in publications to reach Brooklynites and Upper West Siders.
The campaign was successful — from roughly 2000 to 2010, the population stabilized.
However, now White resident “move-ins” are surpassing Black resident “move-ins.” Coalition Director Nancy Gagnier noted that the families drawn to SOMA for its diversity may now be crowding that diversity out.
The report — which compiled and analyzed data from the US Census, Home Mortgage Data Assessments, American Community Survey data and South Orange-Maplewood School District school enrollment data — found that:
- The income of South Orange Black residents in the late 1990s through 2007 exceeded that of Whites; now the income of Black residents in both towns is lower and there is an increasing income gap between Blacks and Whites.
- There is now a distinct trend in the increase of White in-movers in SOMA, an increase in Asian and Hispanic in-movers, and a decrease in Black in-movers.
- There is a clear increase in the White population in the elementary and middle schools that will manifest in the high school soon.
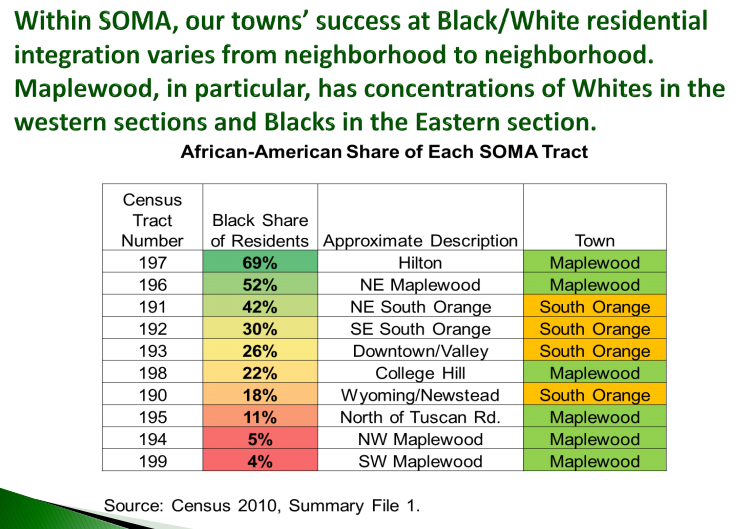
Also, of note: South Orange tends to be more integrated than Maplewood block by block:
The report also drilled on racial trends in school enrollment, noting that:
- Overall Black enrollment has decreased for 10 consecutive years; between 1998 and 2014 it fell 18%.
- Overall White enrollment has increased for 10 consecutive years; between 1998 and 2014 it increased 22%.
- Hispanic enrollment has increased over time; the 2014 Hispanic share is higher than the 1998 share in every grade.
- The growth of Asian total enrollment counts plateaued in 2011; as the years pass, the Asian share is rising in lower grades.
Other trends and data in the report include housing trends, income trends, numbers on foreign-born residents (a whopping 23% of the towns’ population), the increase in the Asian and Hispanic populations, affordable housing percentages as compared to similar New Jersey towns, and more.
To see the full report, visit here or scroll down. Village Green will also be posting follow-up stories on individual trends and data sets in the report.
The November 10 presentation was largely just that — a presentation of the findings. Meetings and discussions on addressing the trends are forthcoming.
In the meantime, Gagnier told Village Green, “To maintain and even grow the diversity this community cherishes, we are considering strategies to attract and retain African American in-movers who have been moving here in much smaller numbers, finding their homes in other suburban communities, as well as the emerging racial groups — Asians and Hispanics — that have grown in SOMa over the last decade.”
She added: “These strategies have to be on two fronts: making sure our community is truly inclusive and offers these populations reasons to choose SOMa as their home; developing a strategic marketing plan that rivals the effectiveness of the Coalition’s marketing from its early years.”
Click on images to enlarge: