From Victoria Carter

Four months ago, we did a housing market snapshot with data showing the impact of COVID-19 on the New Jersey housing market. Homebuyers were flocking to New Jersey from New York City, 30-year fixed mortgage rates had hit an all-time low, and much of the traditional home buying process went virtual due to stay-at-home orders.
I thought it might be interesting to take another look at the housing market, but this time the year-to-date (YTD) data through September 2020 compared to the same period last year.
The results are striking.
The major markets in northern New Jersey are still seller’s markets—housing demand is exceeding supply—leading to multiple bidding situations and rapidly moving inventory. There is a new buzzword to describe housing prices in our area, which reflect a “COVID-premium.” However, as you will see from the snapshots below, housing prices are driving different market dynamics with higher-priced homes in Millburn, for example, seeing less lift from the on-going pandemic.
The charts used below are for our clients and can be found on our website under Market Reports. They cover 18 different towns in northern New Jersey, are updated monthly, and there is also a year-end comparison by town. You are welcome to download and print them.
We will look at the same four communities we looked at in our four-month snapshot, and we have added in Short Hills, an enclave of Millburn Township. To look at others, please visit our website.
1. Maplewood, NJ
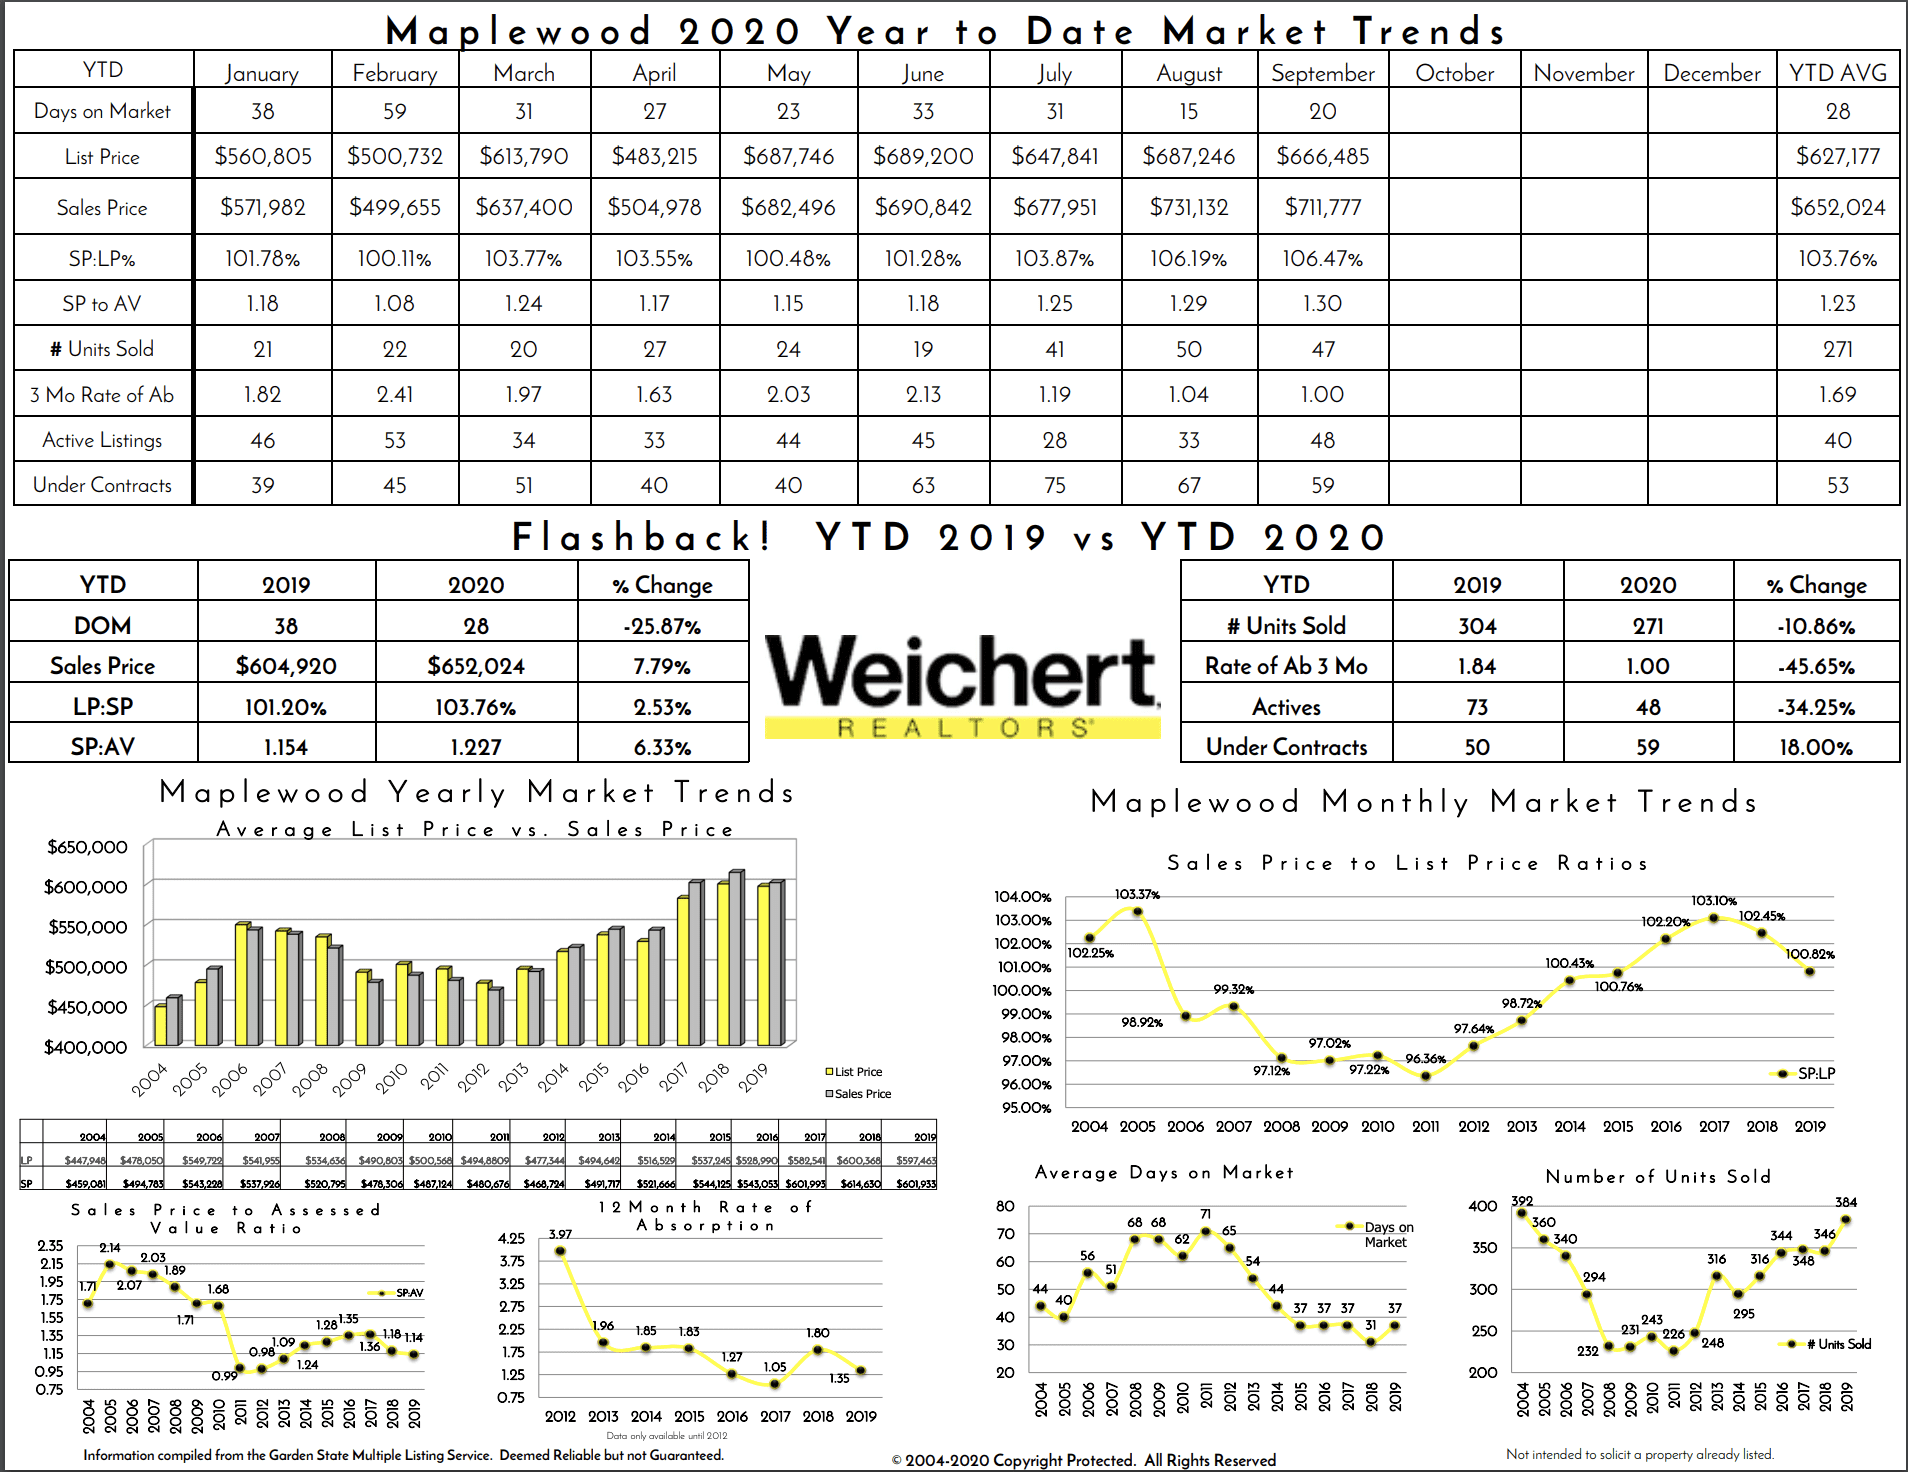
September YTD 2020 vs. September YTD 2019
- Average sale price: $652,024: +7.8%
- Days on the market: -26%
- Sale Price/Average Sale Price: 1.227 +6.3%
- Number of active listings: -34%
Download the year-to-date Maplewood report.
2. South Orange, NJ
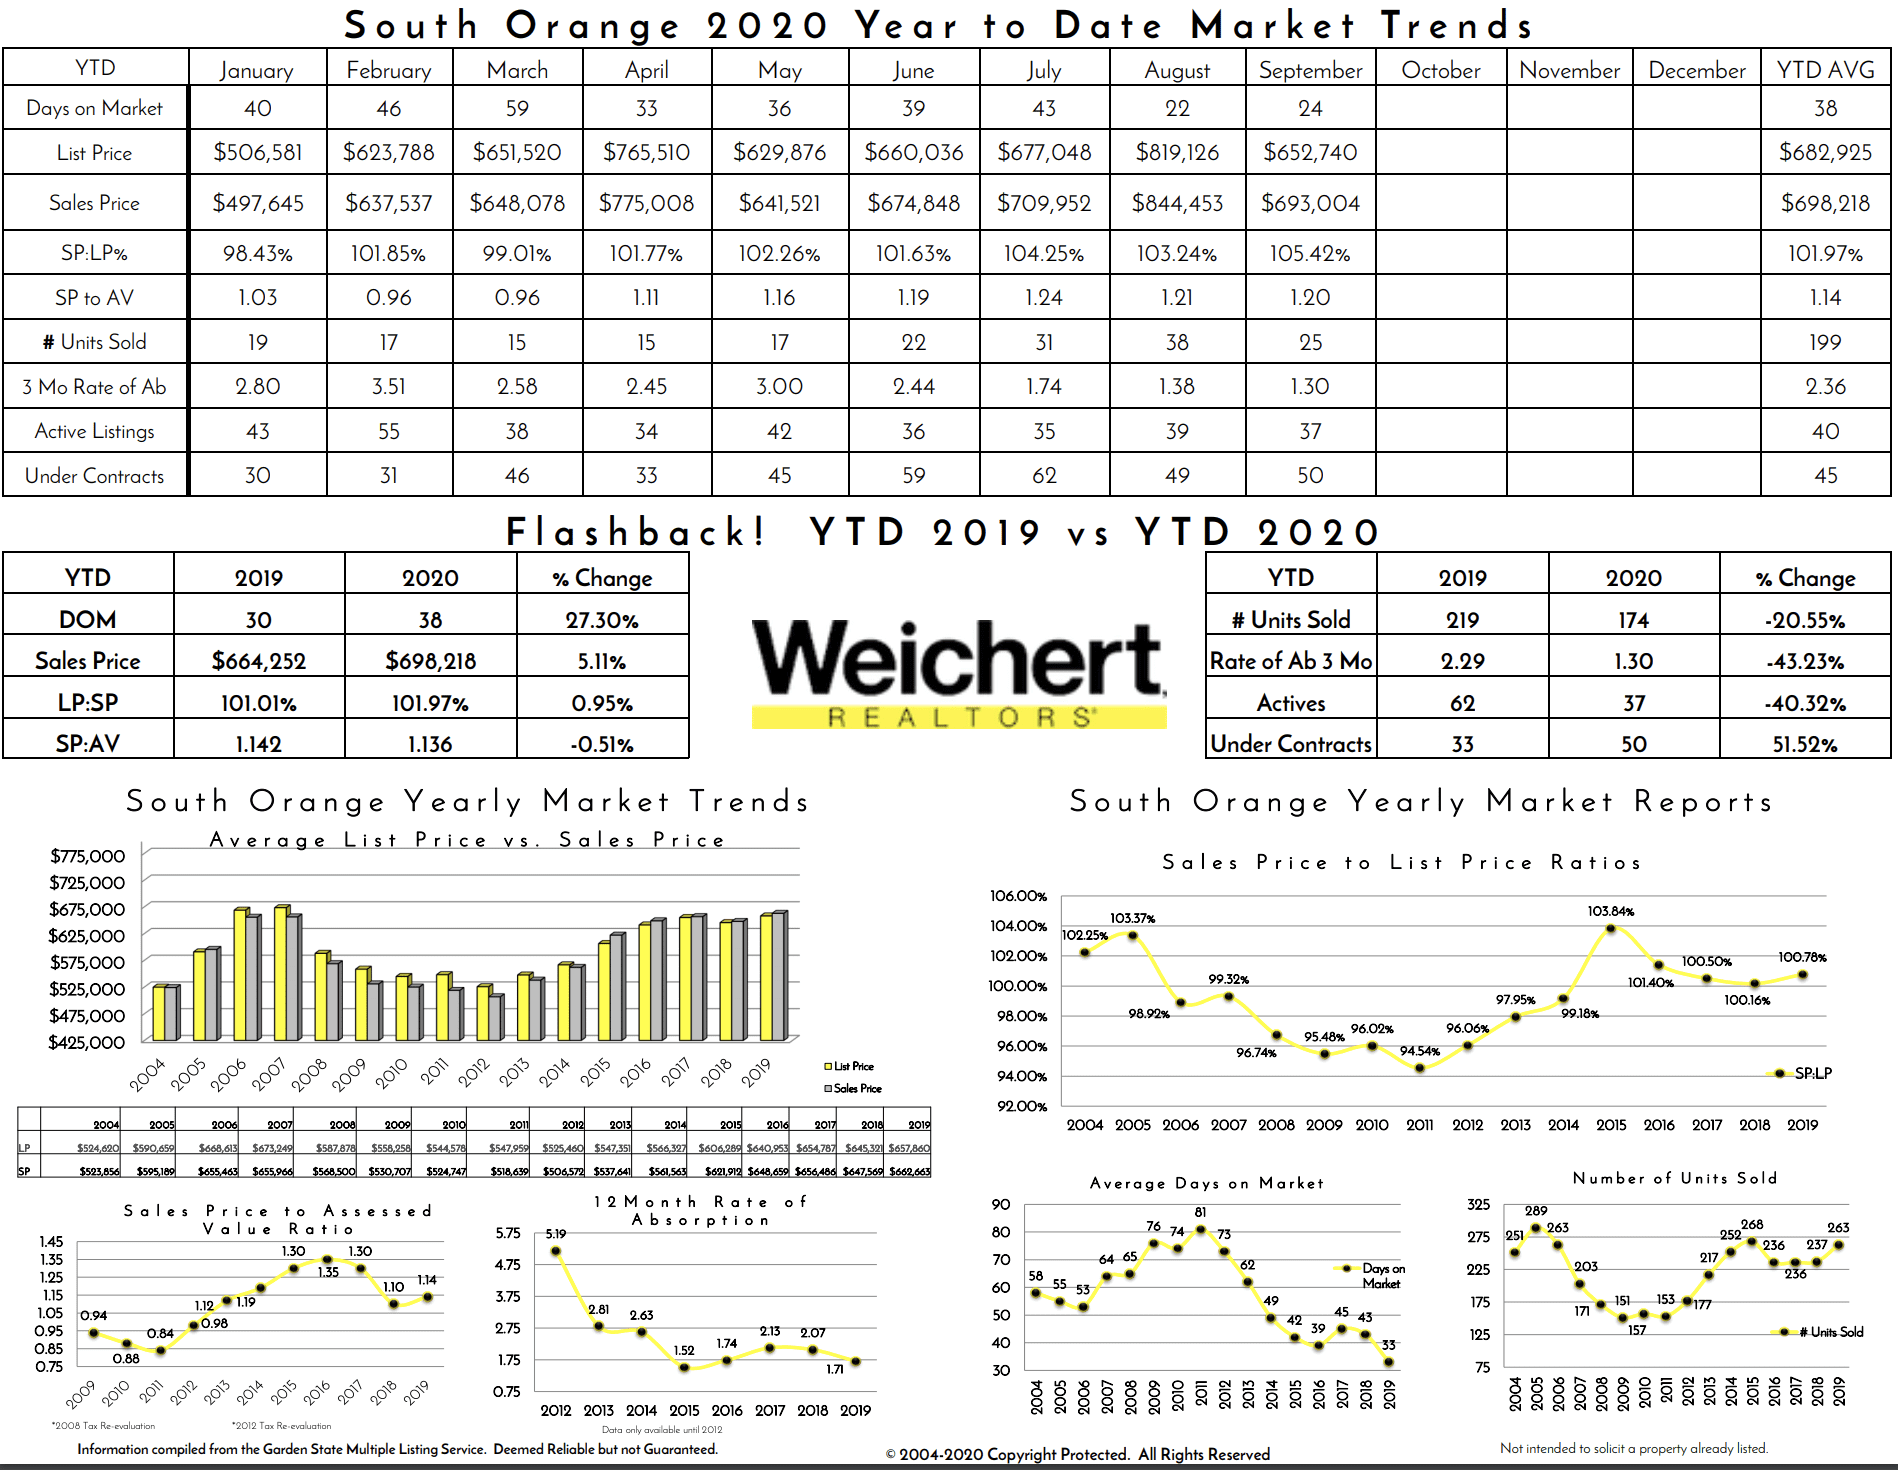
September YTD 2020 vs. September YTD 2019
- Average sale price $698,218: +5.11%
- Days on the market: +27%
- Sale Price/Average Sale Price: 1.136 -0.51%
- Number of active listings: -40%
Download the South Orange report.
3. Millburn and Short Hills, NJ
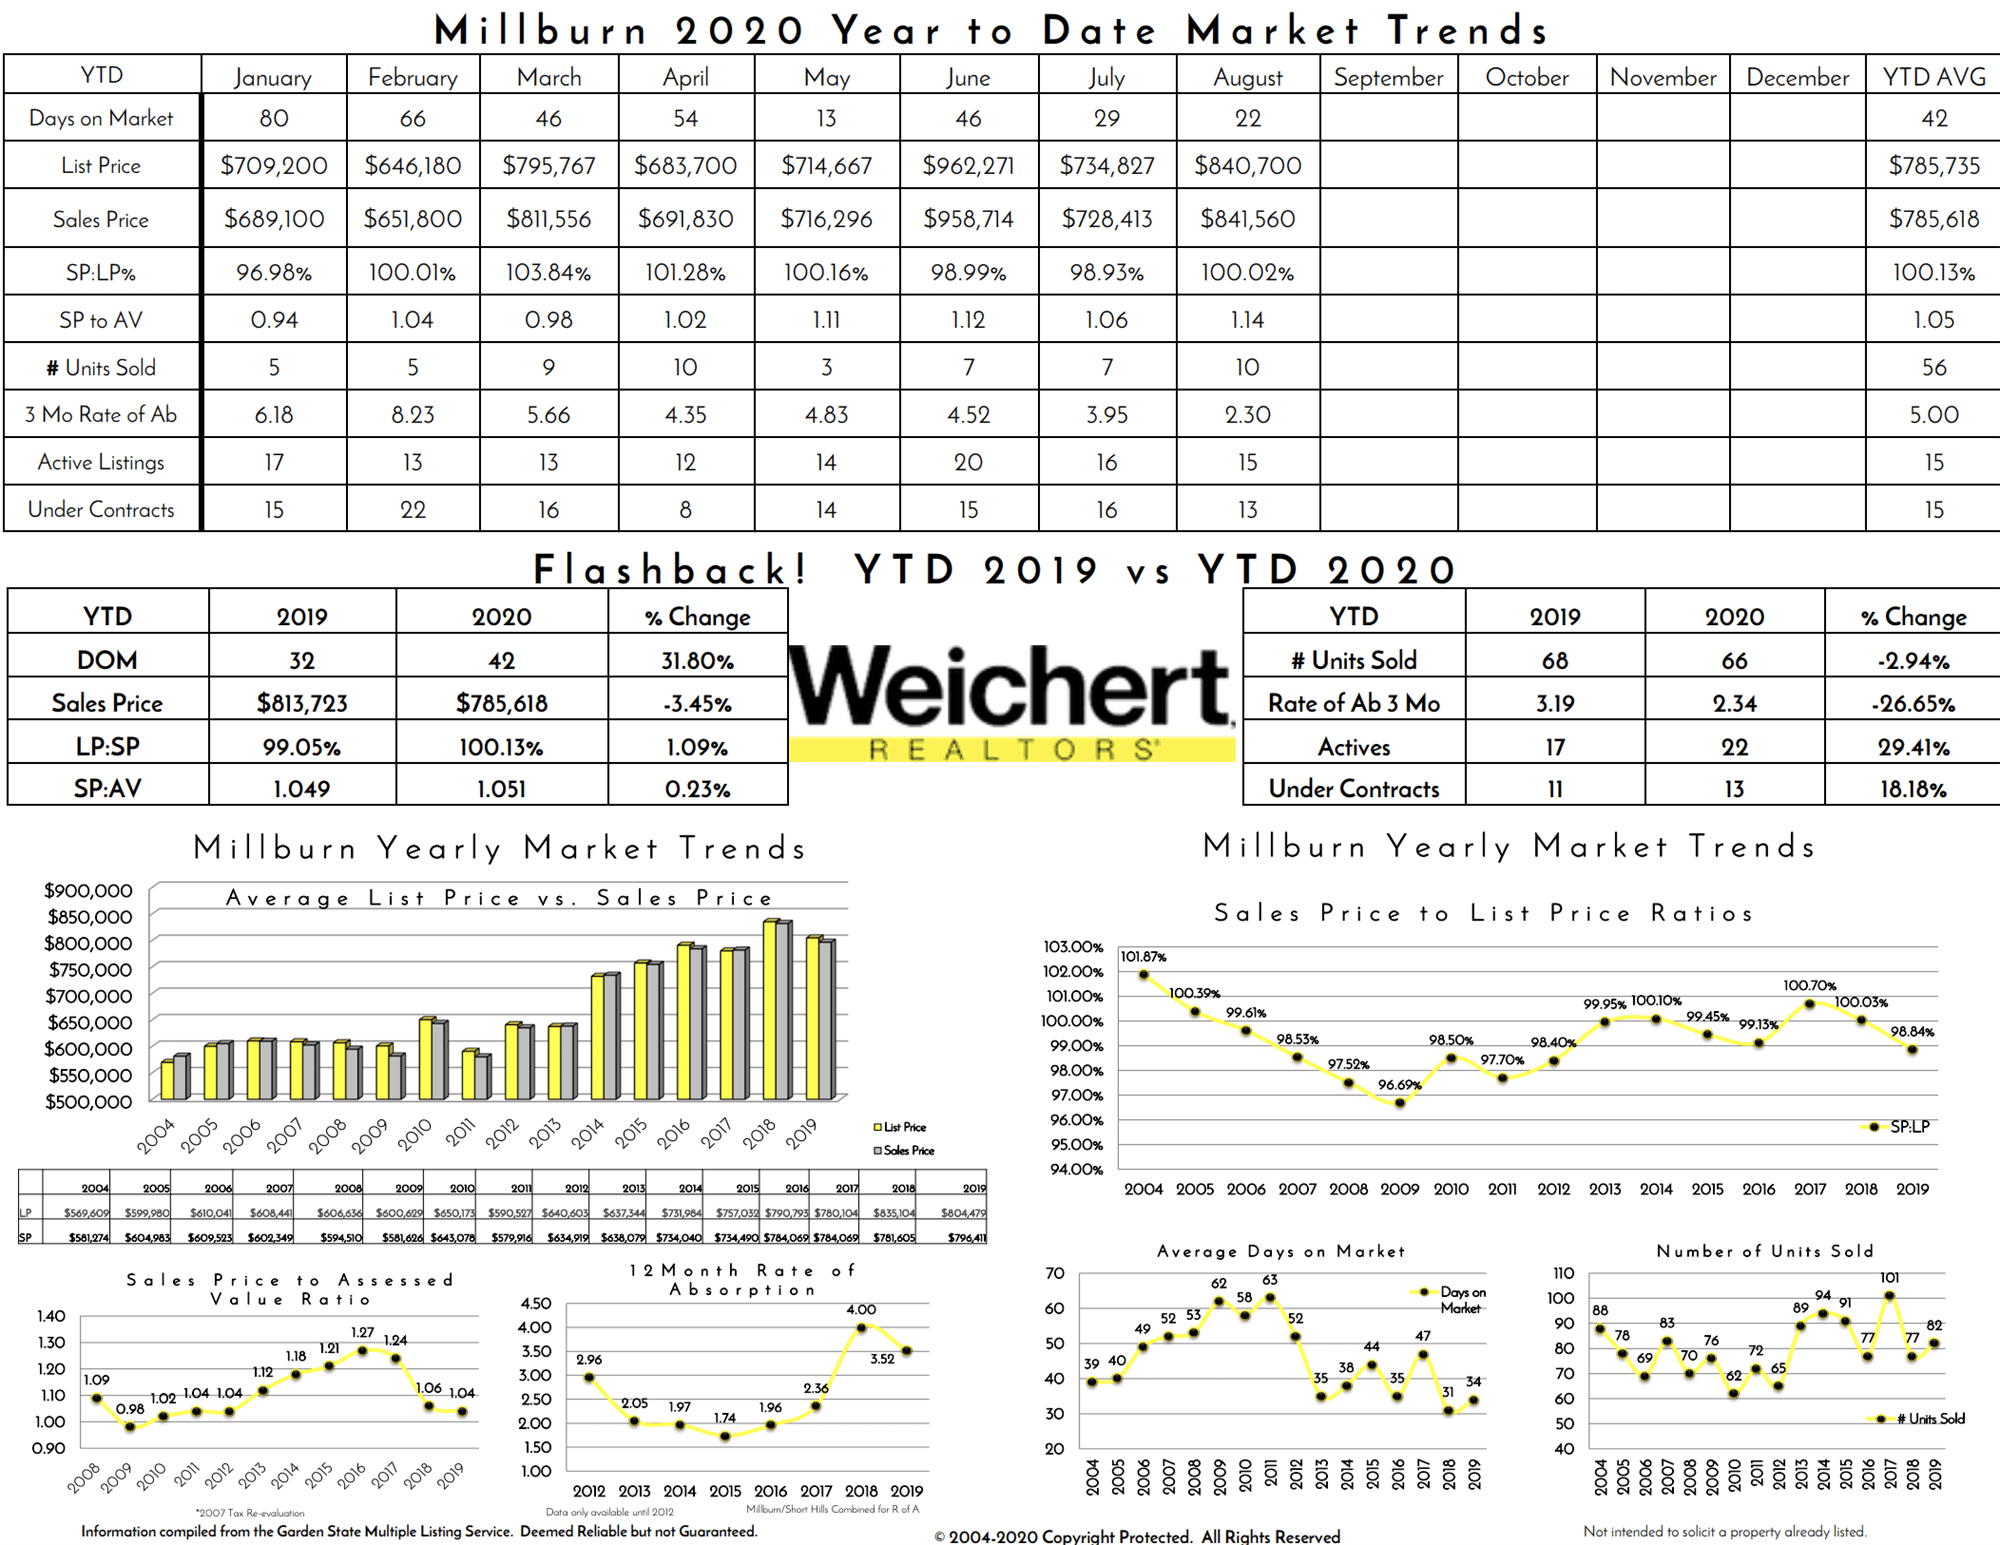
Millburn
September YTD 2020 vs. September YTD 2019
- Average sale price $785,618: -3.45%
- Days on the market: +32%
- Sale Price/Average Sale Price: 1.051 -0.23%
- Number of active listings: +29%
Download the Millburn report.
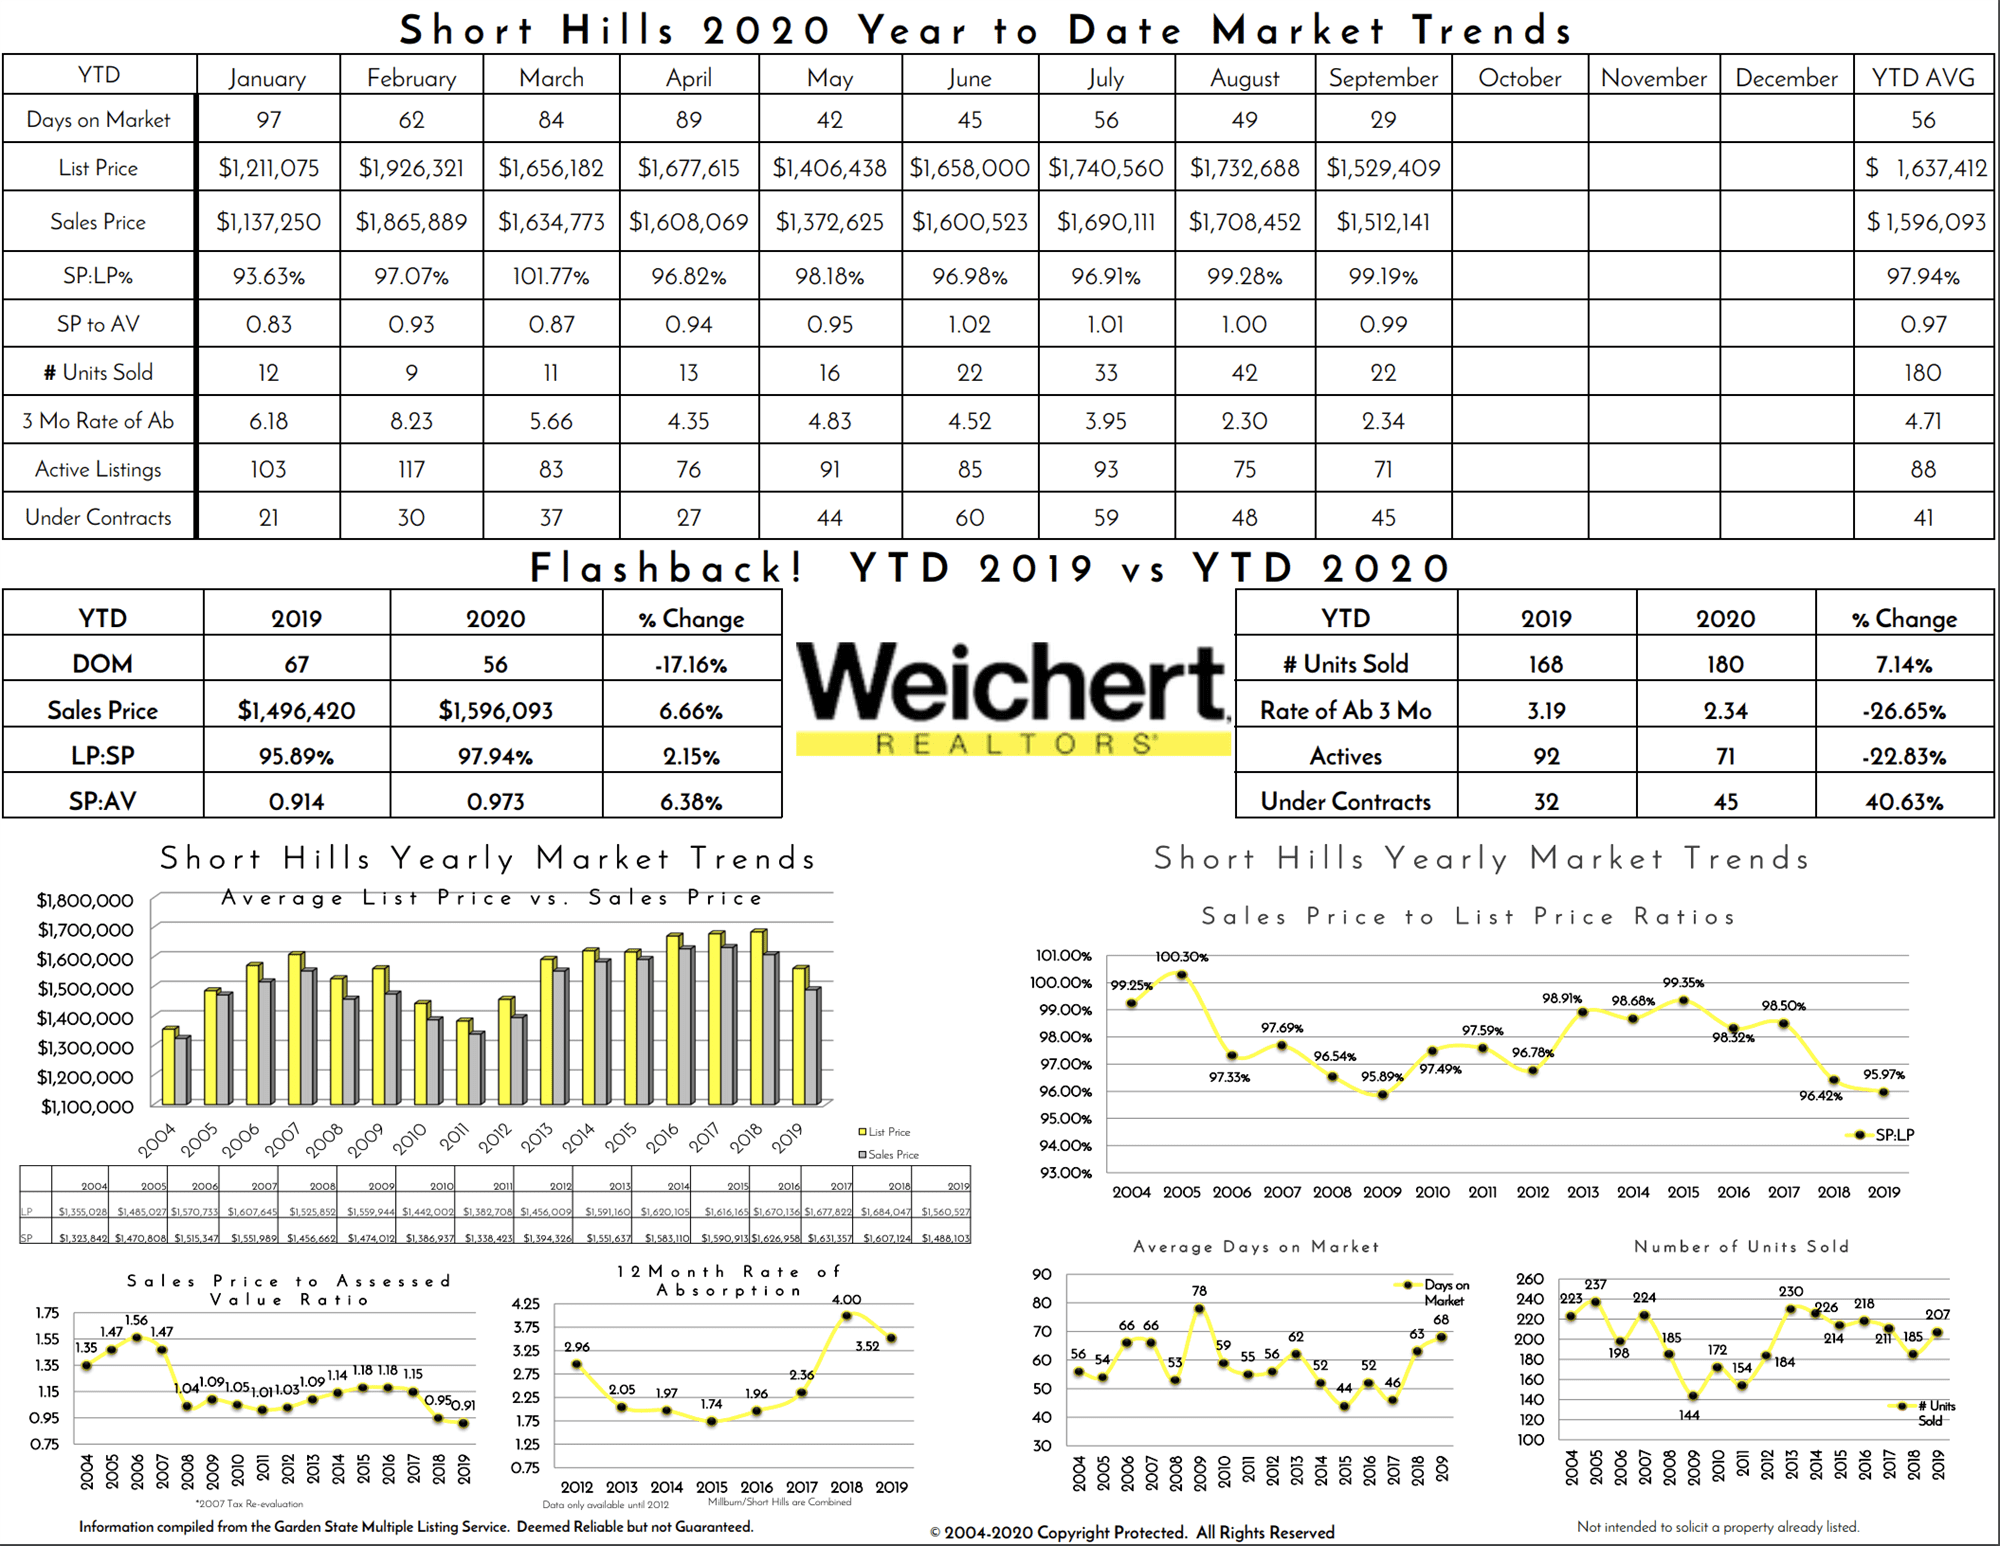
Short Hills
September YTD 2020 vs. September YTD 2019
- Average sale price $1,596,093: +6.66%
- Days on the market: -17%
- Sale Price/Average Sale Price: 0.973 +6.38%
- Number of active listings: -23%
Download the Short Hills report.
4. West Orange, NJ
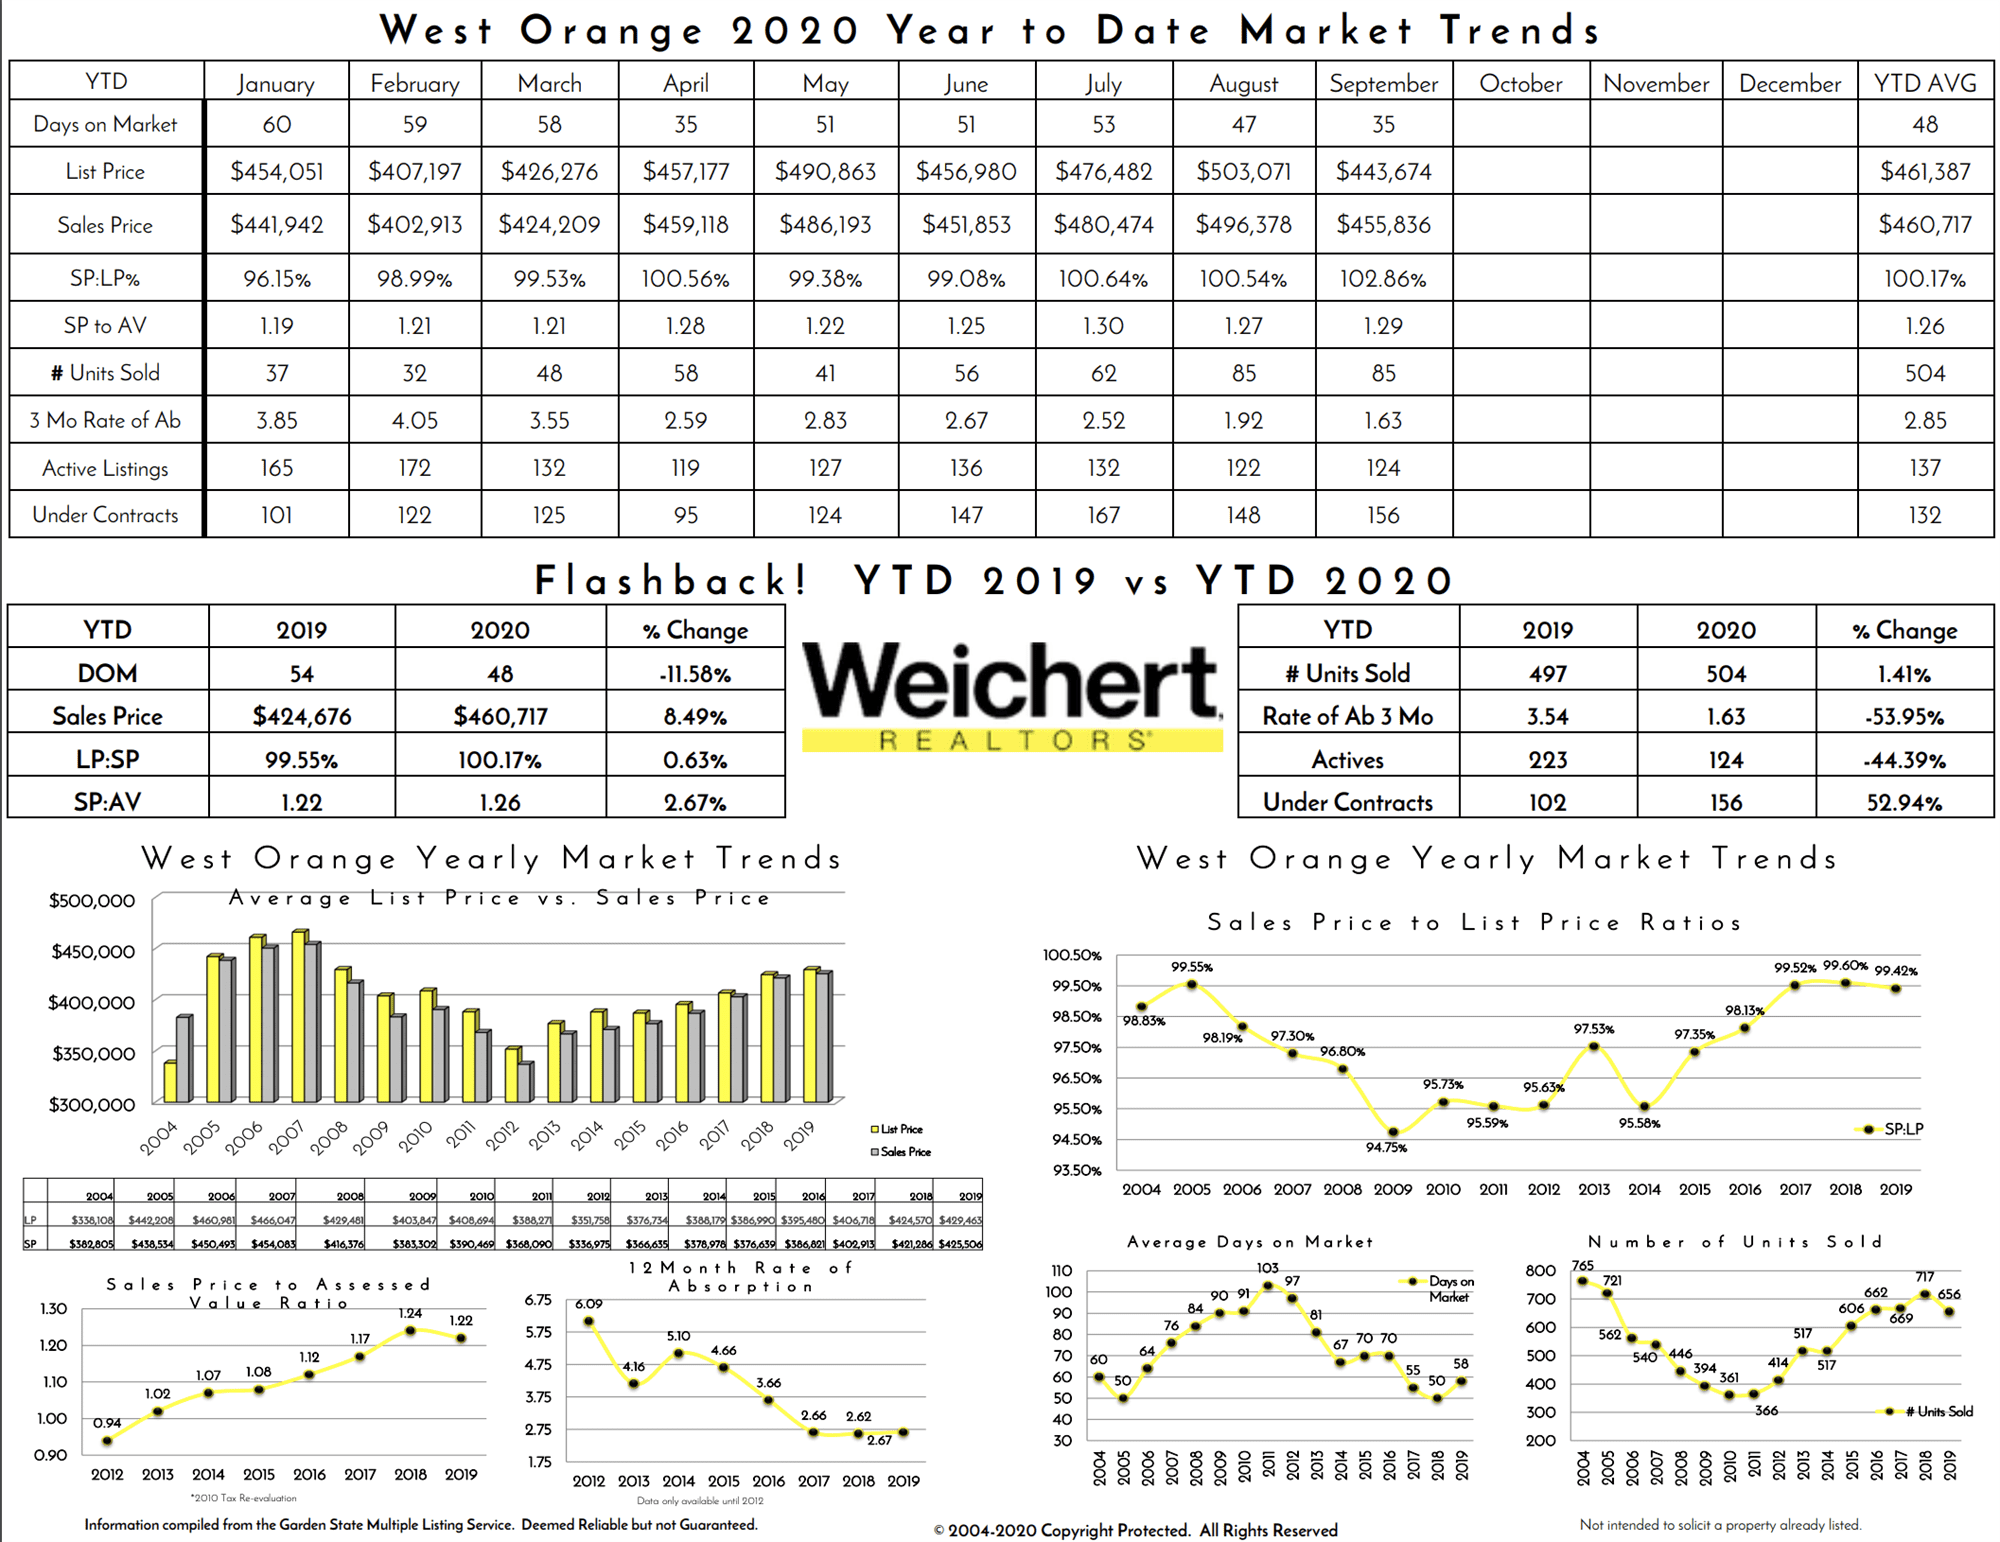
September YTD 2020 versus September YTD 2019
- Average sale prices $460,717: +8.49%
- Days on the market: -11.5%
- Sale Price/Average Sale Price: 1.26 +2.67%
- Number of active listings: -44%
Download the West Orange report.
So, now you have a 9-month view of the pandemic housing market in northern New Jersey. Real estate markets remain active, and housing inventory is tight. We are seeing renters from Hoboken, Jersey City and New York City move into the area at an accelerated pace in search of great schools, more indoor and outdoor space, and versatile work-from-home environments.
If you are interested in buying or selling a home in northern New Jersey, please contact me. I would love to assist you. Call (973) 220-3050 or email [email protected].